Analysis for smarter investing decisions.
Master Your Portfolio
The backbone to AnaLenz
![[interface] image carousel of ai innovations for a healthcare company](https://cdn.prod.website-files.com/6980cc5b65cf8a0734db2a3c/698a6f9f92b80262347d80fa_Screenshot%202026-02-09%20at%2011.25.16%E2%80%AFAM.png)
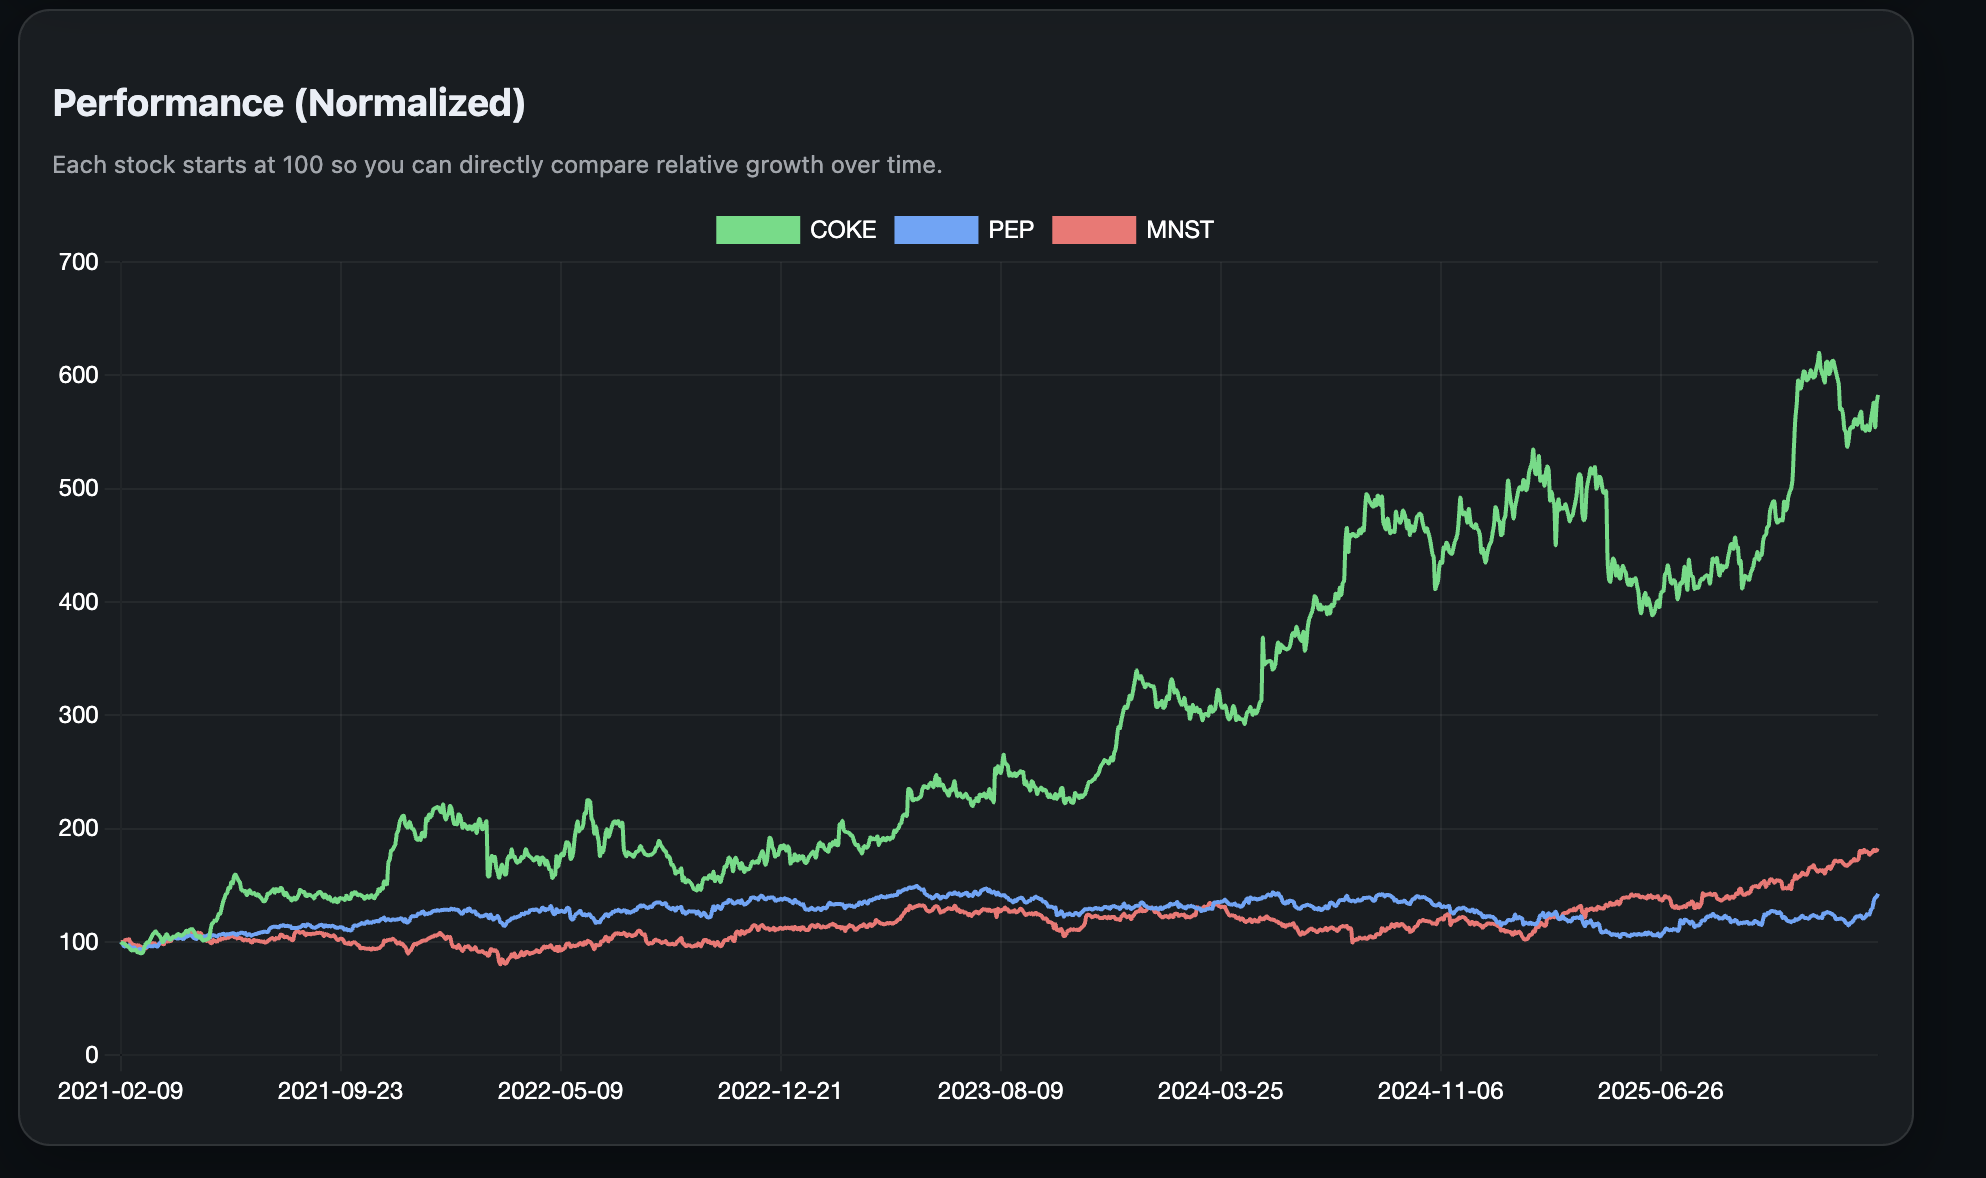
The math behind our most impressive tool.
Correlation measures how similarly two assets move over time. Mathematically, it ranges from −1 to +1 and is calculated from the covariance of two return series divided by their standard deviations. A value near +1 means the stocks move together, while 0 means they are unrelated, and negative values move opposite each other. In practice, correlation is one of the most powerful tools for diversification. Combining low-correlation assets can reduce portfolio risk without sacrificing returns, which is why professional portfolio managers focus heavily on correlation matrices when constructing balanced portfolios.
The Sharpe Ratio measures return per unit of risk. It’s calculated as:
(Portfolio Return − Risk-Free Rate) ÷ Volatility.
This tells you how efficiently your risk is being rewarded. A higher Sharpe means you are earning more return for each unit of volatility you accept. For context, a Sharpe above 1.0 is considered strong, above 2.0 is elite (typical of top hedge funds), and Warren Buffett’s long-term Sharpe is estimated around ~0.8–1.0. Investors often prefer a smoother, high-Sharpe strategy over one with higher raw returns but extreme swings. Reducing risk can be just as important as improving returns.
Volatility measures how much prices fluctuate over time. Technically, it’s the standard deviation of returns, which quantifies how spread out performance is around the average. Higher volatility means larger price swings and greater uncertainty. While volatility is often called “risk,” it’s better thought of as instability. Two investments might have similar returns, but the one with lower volatility is generally easier to hold and produces more consistent growth. Reducing volatility through diversification is a critical principle to understand early in your investment journey.
Returns measure how much an investment grows over time. This is typically calculated as a percentage change or compounded growth of prices. Returns are the primary driver of wealth creation, but they mean little without considering risk. For example, a 20% return achieved with extreme volatility may be less attractive than a steady 12% return. Professional investors evaluate returns together with risk metrics to understand true performance, not just raw gains.
Market capitalization reflects the size of a company. It’s calculated as:
share price × shares outstanding
Larger companies (large-caps) tend to be more stable and diversified, while smaller companies (small-caps) often grow faster but carry higher risk. Market cap helps investors balance stability versus growth potential. Many portfolios blend different market caps to capture both resilience and upside.
CORE brings enterprise level analysis to everyday investors. It began as a simple Python script I built for myself while learning how to analyze stocks. What started as a personal tool to guide my own investing decisions evolved into an incredbile tool for evaluating portfolios using correlation, risk, and returns together. Tested on real portfolios and designed to make professional analysis accessible to anyone learning the market.

![[interface] image of digital wallets (for a blockchain and cryptocurrency).](https://cdn.prod.website-files.com/6980cc5b65cf8a0734db2a3c/698a7020d0d7900a0c9bc14e_Screenshot%202026-02-09%20at%2011.29.56%E2%80%AFAM.png)