
Interpretation of Gas Station Prices Since The Covid-19 Outbreak
Overview
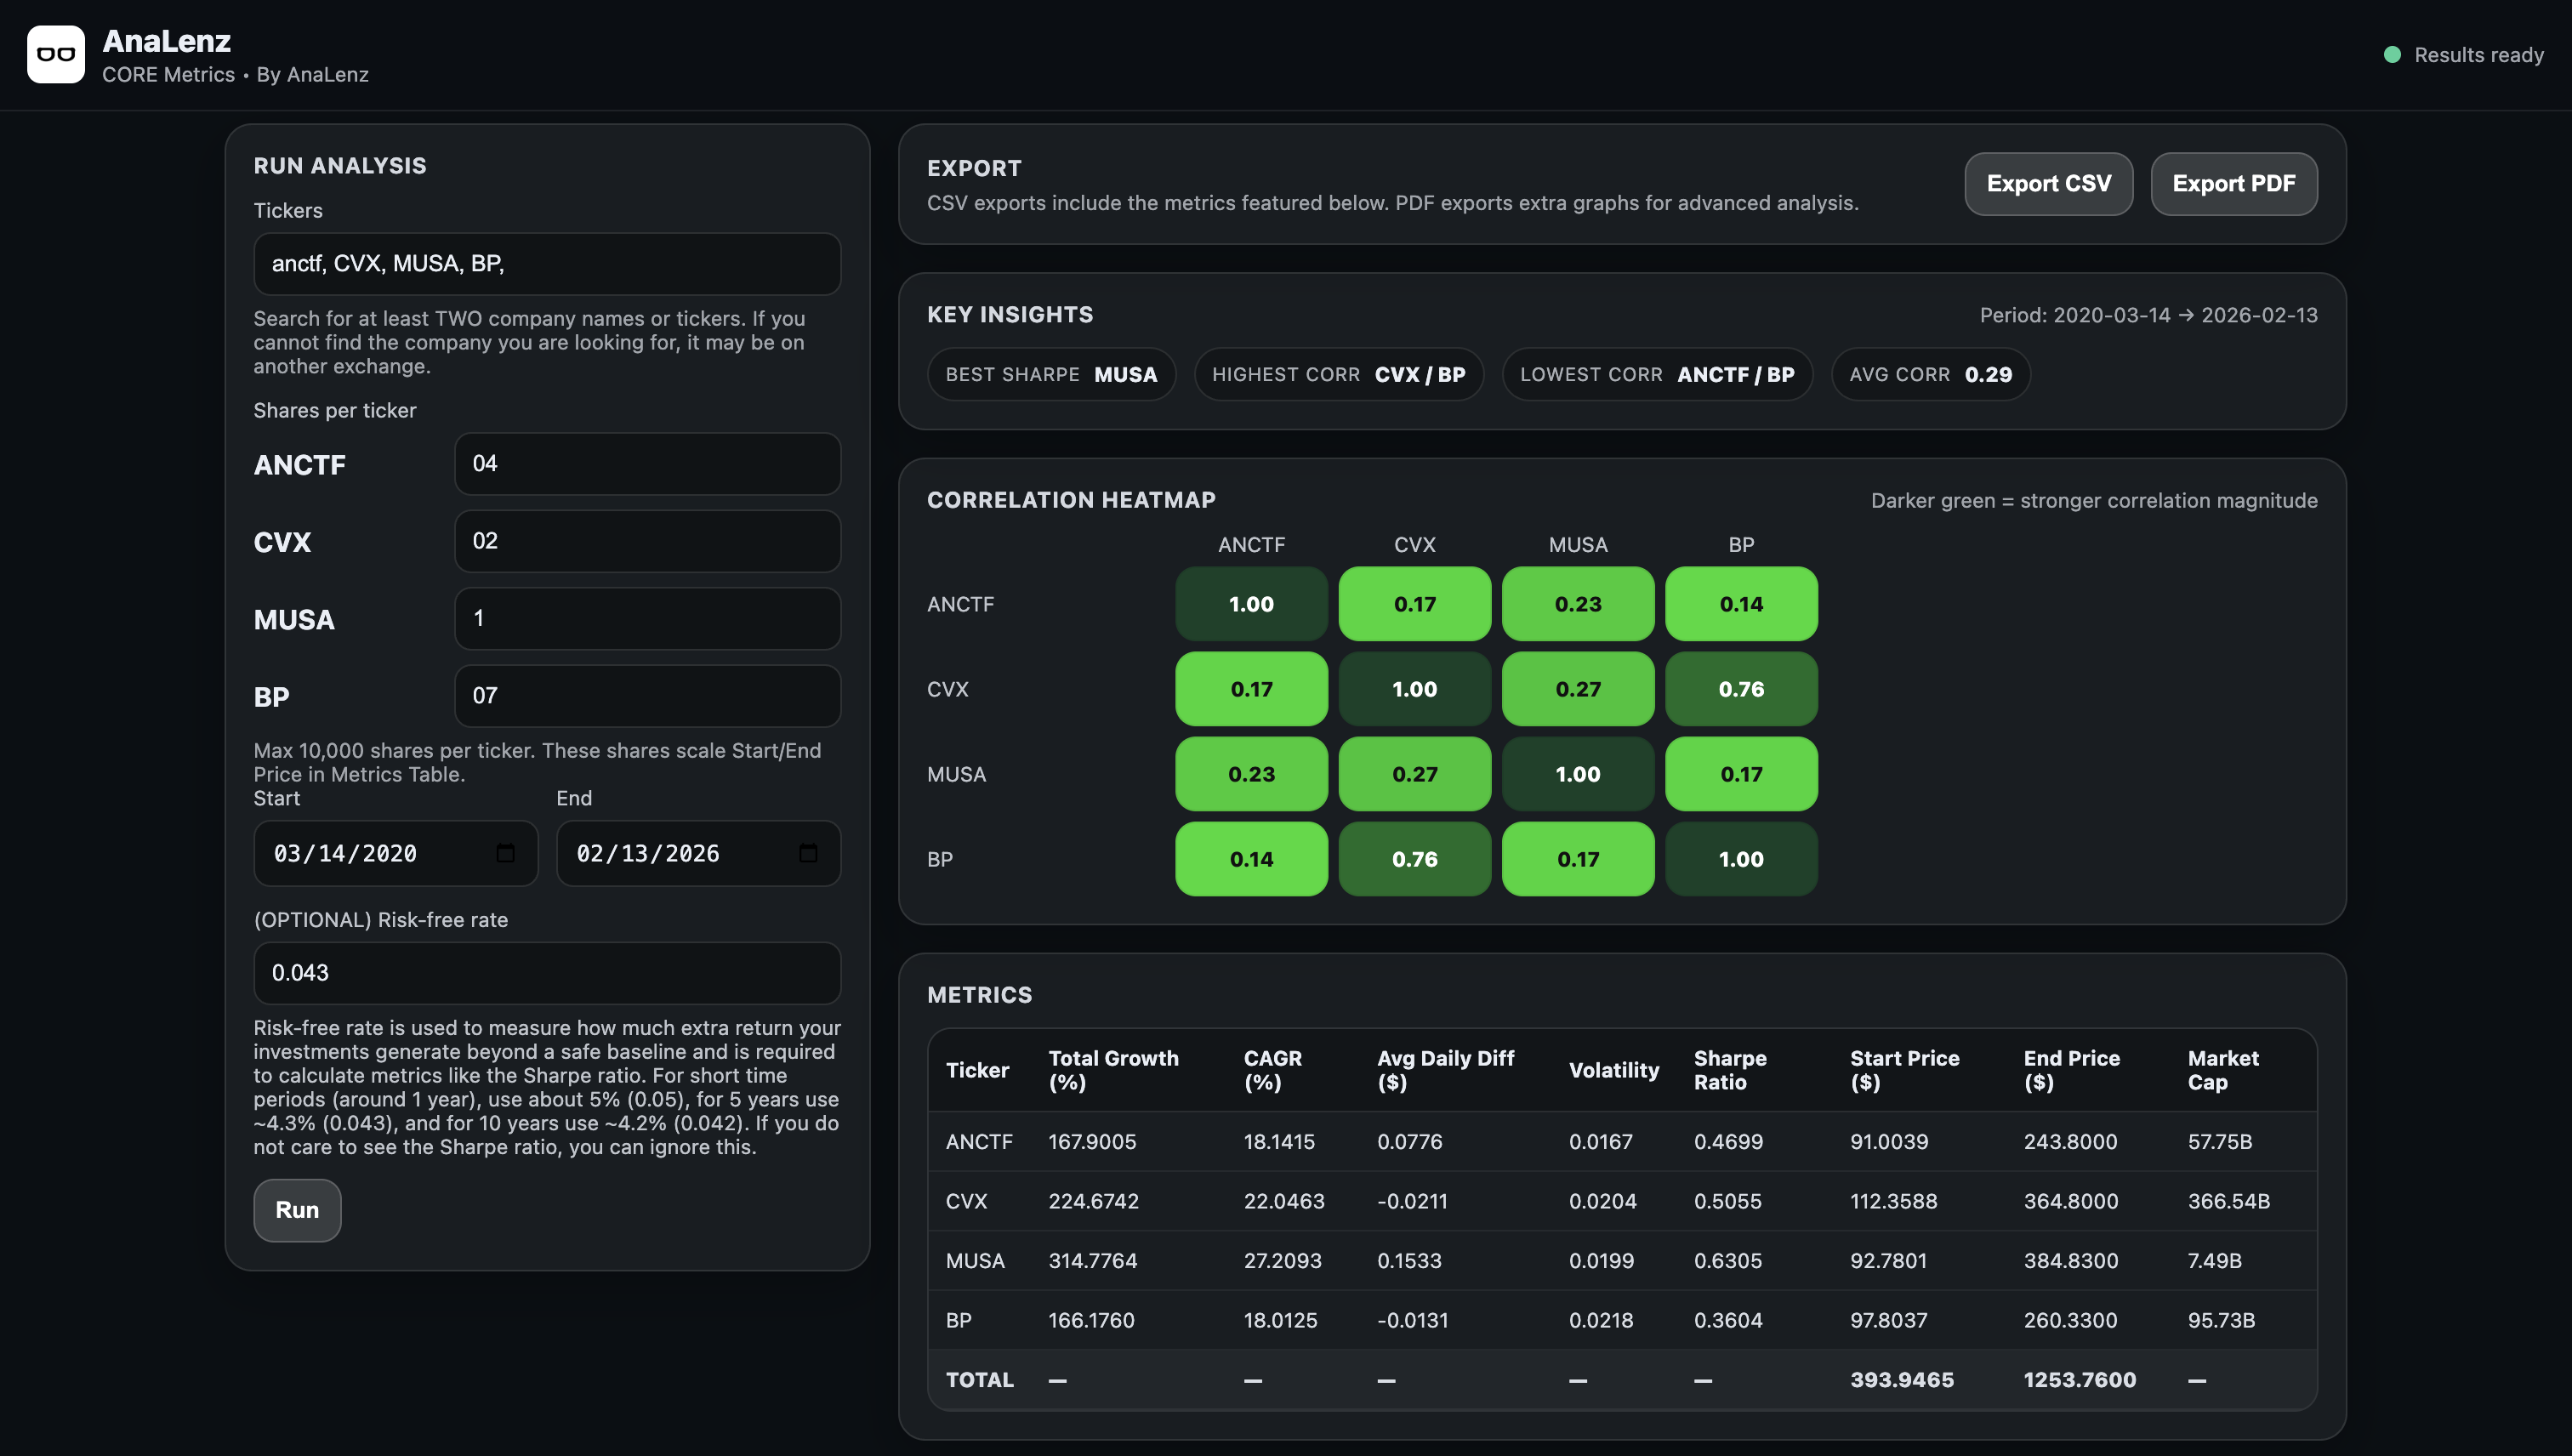
To set up for this analysis, I input four of the bigger names in the American gas station business; ANCTF (Circle K), CVX (Chevron), MUSA (Murphy USA), and BP (British Petroleum). I assigned different amounts of shares to get all the starting prices around $100, bringing the portfolio total to roughly $400, ($393.95). I then selected a date range, starting in March of 2020, and ending in February of 2026. I ignored the Risk-free rate for this analysis as focus will be on tracking individual and portfolio performance against the S&P 500.
Immediate Interpretation
Before even viewing the normalized performance graph, we can clearly see how profitable of a cluster this is. In just a six year span, our orginal investment has more than tripled (~318% growth). While impressive, lets put this into context of the entire market.

Normalized Performance Visualization
The graph above displays each stock at a normalized starting point of 100. Also included is a depiction of the S&P 500 and your inputted portfolio for reference. At the far right of the display, we can uderstand how individual companies performed realitive to each other. It is clear that MUSA has dominated in this time frame, specifically since 2022. Additionally, since American involvement in Venezuela, we can see a collective rise in many gas station share prices. With CVX and MUSA producing incredible returns, lets see how we could adjust our portfolio to take advantage of their performance.

Adjusted Share Prices
In the image above, I adjusted share prices to prioritize our higher performing assets. Our starting total is similar, but in the same time span, our adjusted portfolio grew 362%! Lets compare how this would look against the S&P.

Adjusted Portfolio Versus The S&P 500
With updated share totals, our new portfolio crushes the S&P 500 over these six years. I turned off the display for each company so we could foucs on our portfolio. While we didn't change our initial investment, we still drastically improved our performance.

Quantitative Analysis
How can we act now? We know this industry can produce impressive returns, but we want to capitalize on our knowledge. In quantitative finance there is a method of trading called statistical arbitrage. In a typicaly algorithm, you identify correlated pairs (testing the time series for mean reversion) and trade as they move away from each other. Essentially, you predict two companies will generally follow the same direction in price, when the move too far or too close, you can execute a trade. This practice is performed by many funds and quant firms, but can be done by anyone. As displayed above, CVX and BP showed tight correlation from 2020-22 but have since journeyed further from each other. It will be interesting to see if these companies revert back to closer prices or if they will now move on individual motives.